
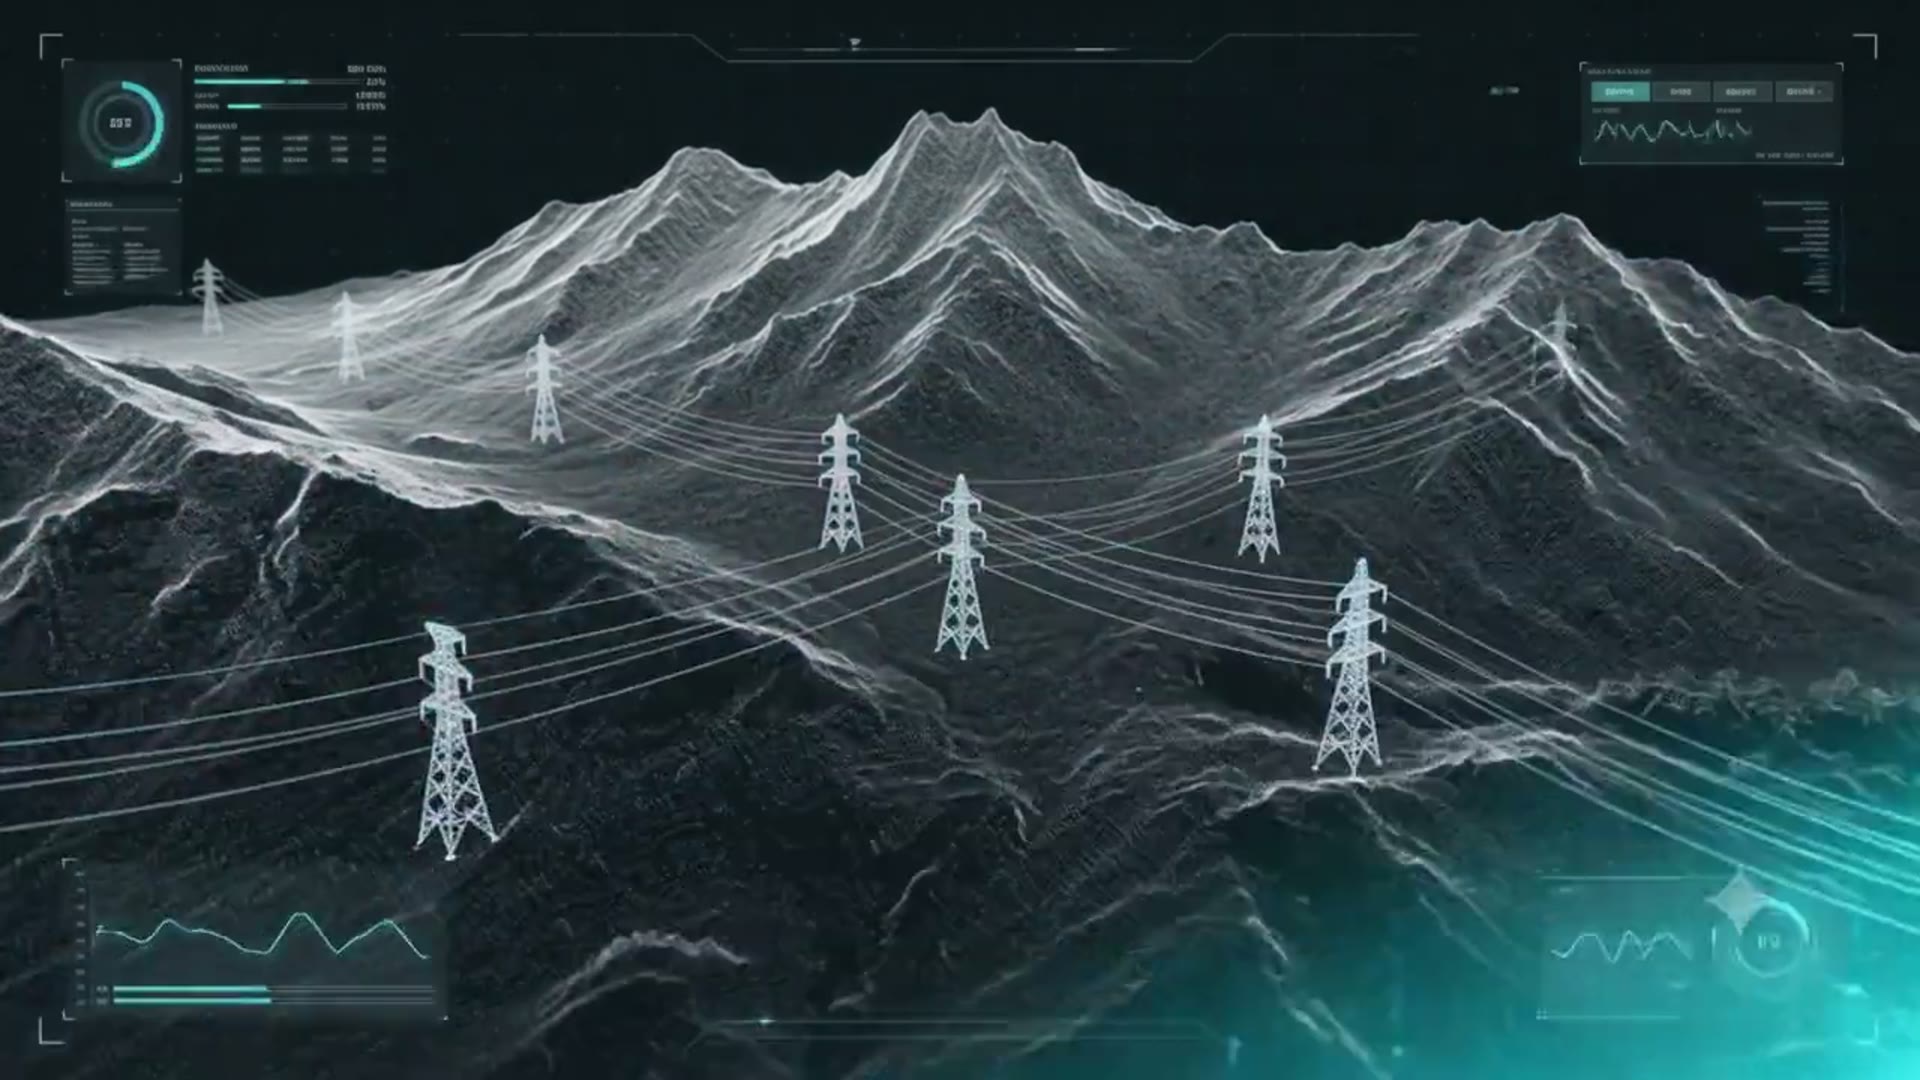
Powerline Mapping & Analysis
Airborne LiDAR classification, 3D conductor modelling and code-compliant clearance analytics — engineered for the world's largest transmission and distribution networks.
End-to-end LiDAR analytics for transmission & distribution — from client-supplied point clouds to PLS-CADD-ready models, code-compliant clearance reports and vegetation work orders. Built for ROW managers, T&D utilities, ISO/RTOs and EPC contractors running inspection, storm-hardening and wildfire-mitigation programmes.
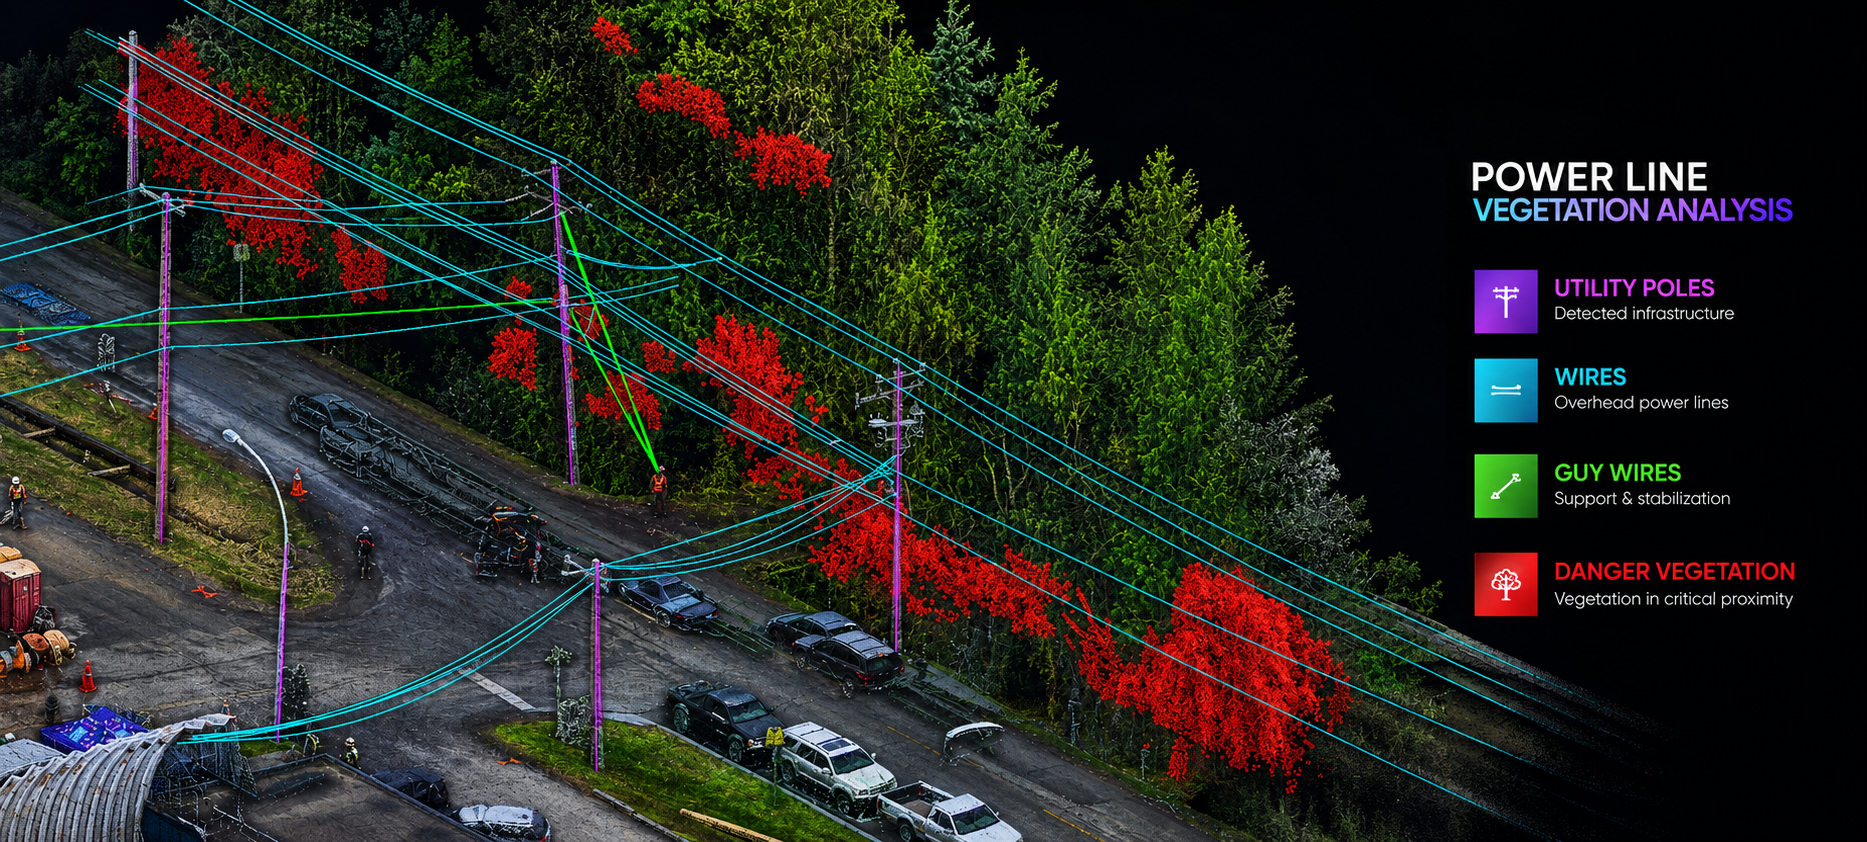
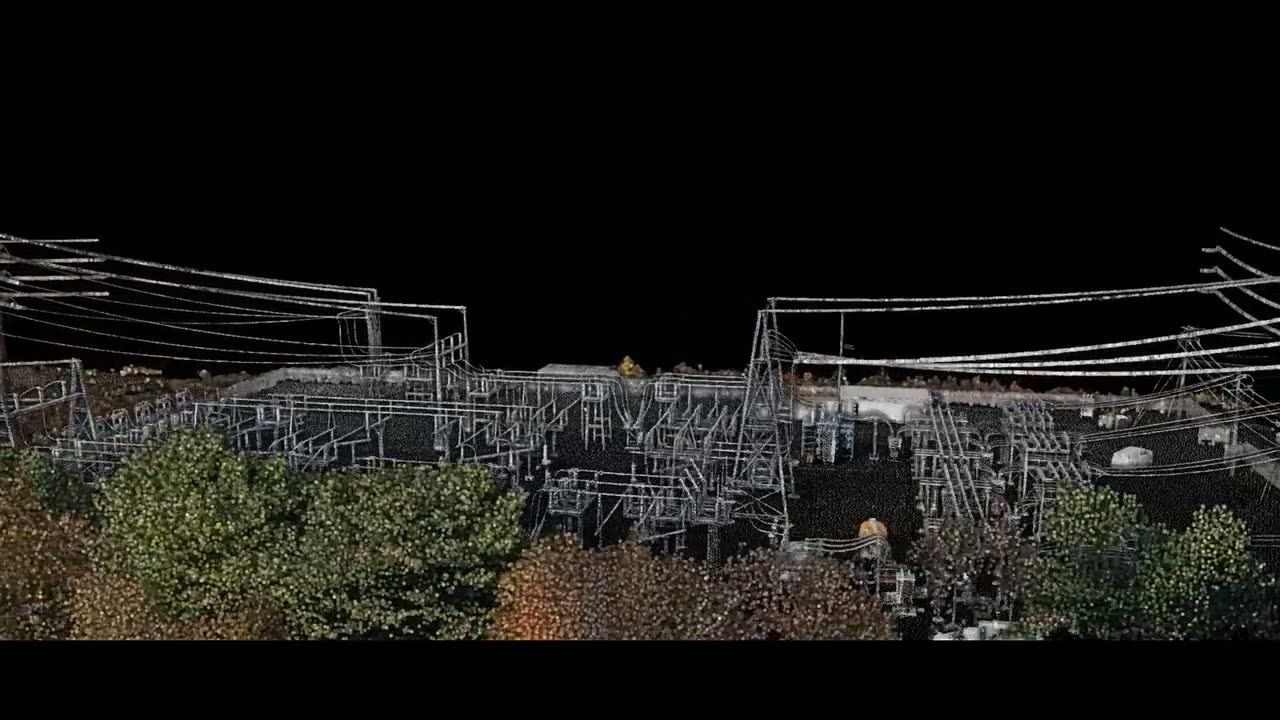
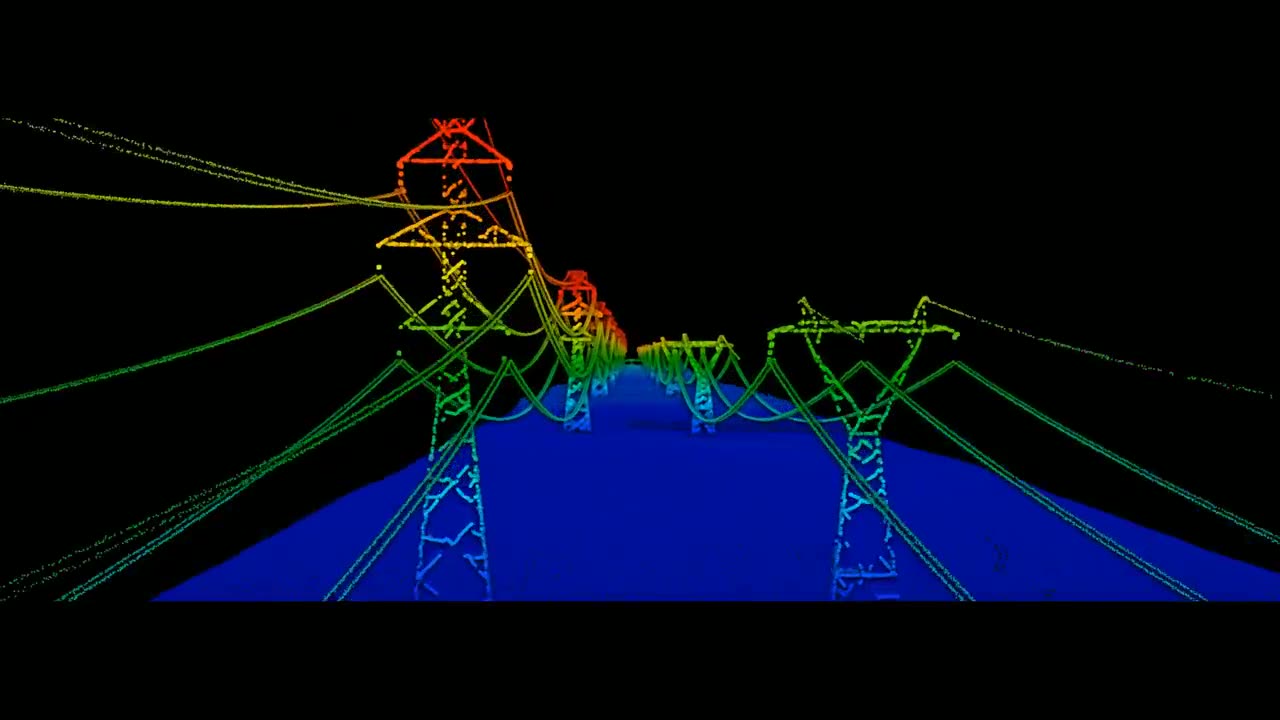
Classified utility poles, wires, guy wires and danger vegetation colorised for critical-proximity clearance review.
All project samples are shared with client permission. We treat every dataset as confidential and never disclose client data.
Want to explore further? Get in touch or schedule a meeting to help build trust.
- 01Classification
Point cloud classified into conductors, shield/OPGW wires, structures (towers, poles, cross-arms), insulators, ground, low/medium/high vegetation and buildings using automated routines with manual QC.
- 02Feature extraction & 3D modelling
Vectorized conductors, structure models, attachment points and span geometry — delivered in formats ready for PLS-CADD, Bentley OpenUtilities and GIS asset systems.
- 03Sag & tension analysis
Catenary fitting per span, conductor temperature normalization per IEEE 738, and thermal rating checks against as-designed sag curves to flag under- or over-tensioned sections.
- 04Clearance & encroachment checks
3D clearance analysis against ground, vegetation, structures, buildings and crossings, evaluated against NESC, IEC or country-specific codes with per-span pass/fail reporting.
- 05Vegetation risk
Fall-in, grow-in and blow-out zone modelling with growth projections; prioritized cut lists and work orders geolocated to the pole or span.
- 06QA/QC & reporting
Multi-stage QC using stereo and imagery cross-checks, followed by client-format deliverables, dashboards and stakeholder reports.
- Transmission ROW inspection & compliance audits
- Distribution reliability & pole loading studies
- Storm hardening and post-event damage assessment
- New-build design validation against as-flown reality
- Wildfire mitigation & vegetation management programmes
- Classified point cloud (.LAS / .LAZ) with utility schema
- 3D structure & conductor models (.DGN / .DWG)
- PLS-CADD compatible datasets (XYZ, structures, wires)
- Encroachment & clearance reports (PDF + .SHP / GeoJSON)
- Vegetation management work orders per span / pole
- Corridor orthophotos and true-view panoramas